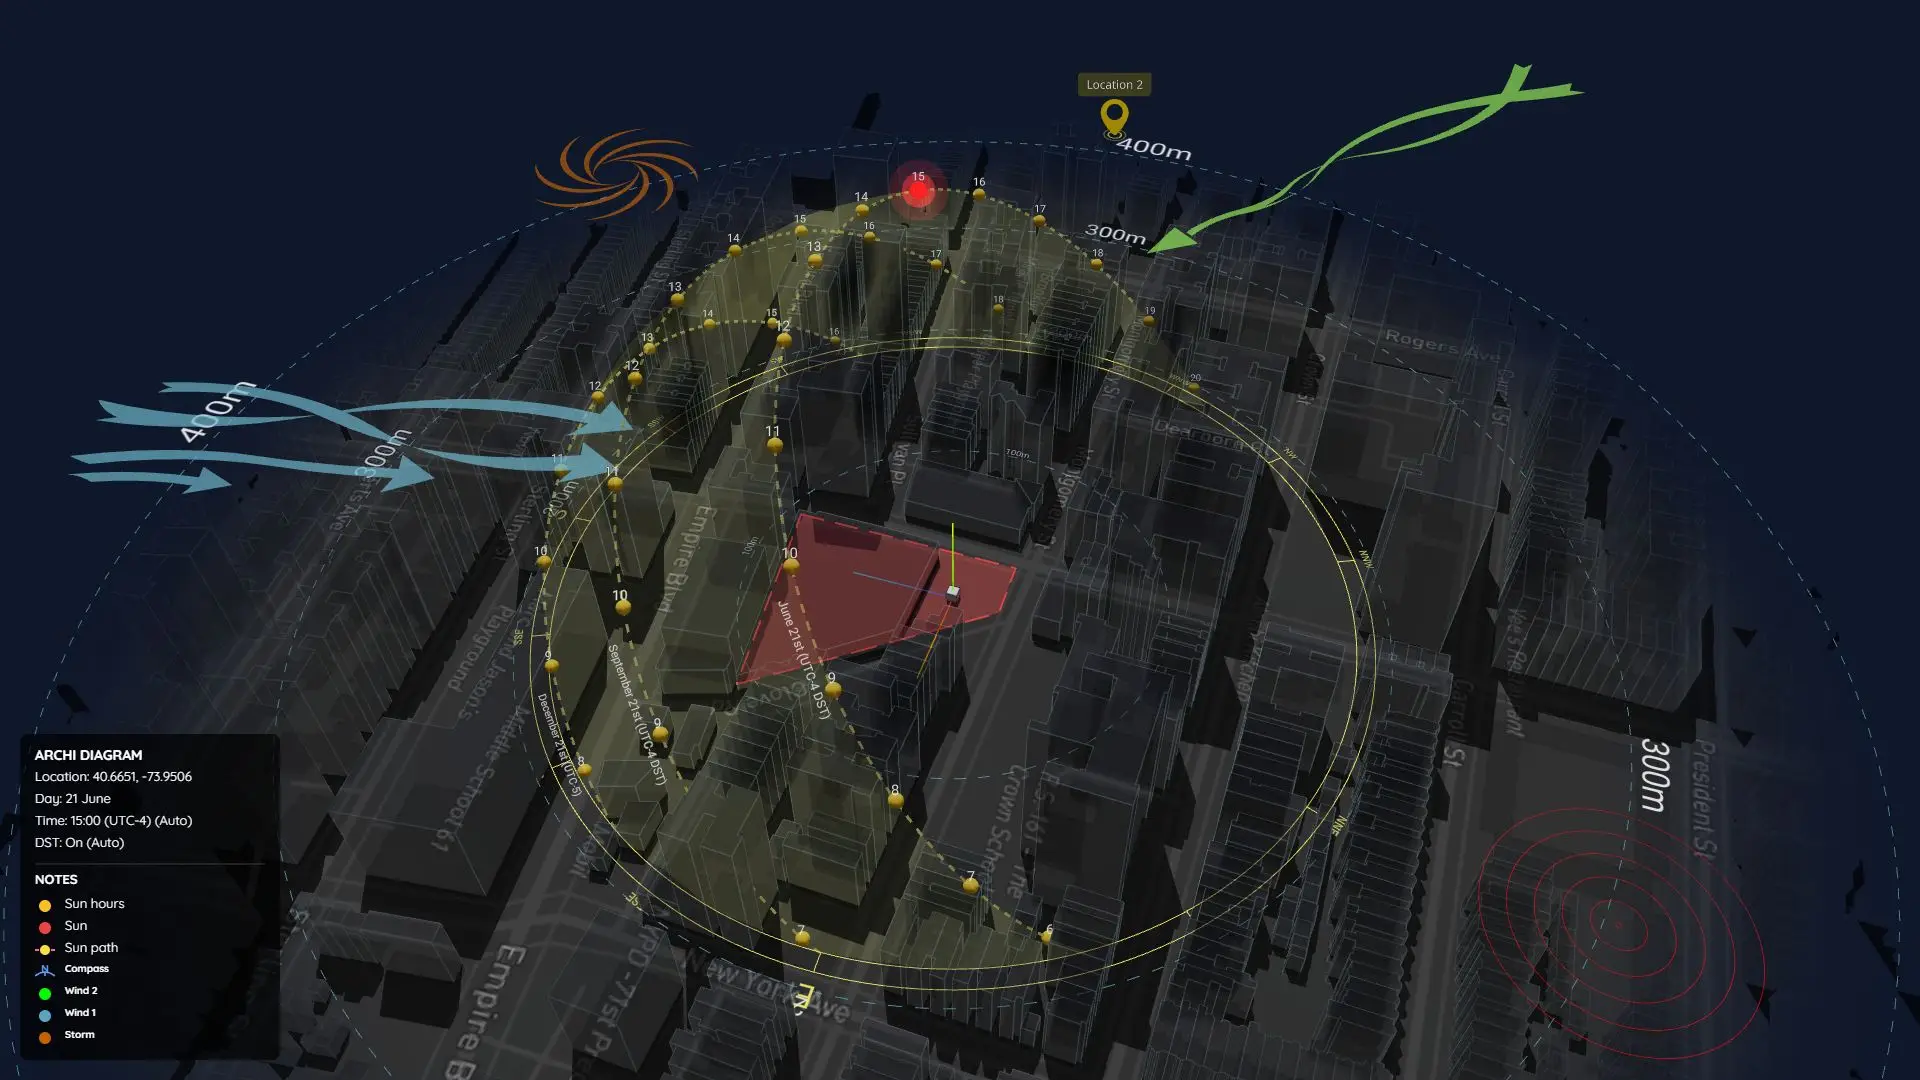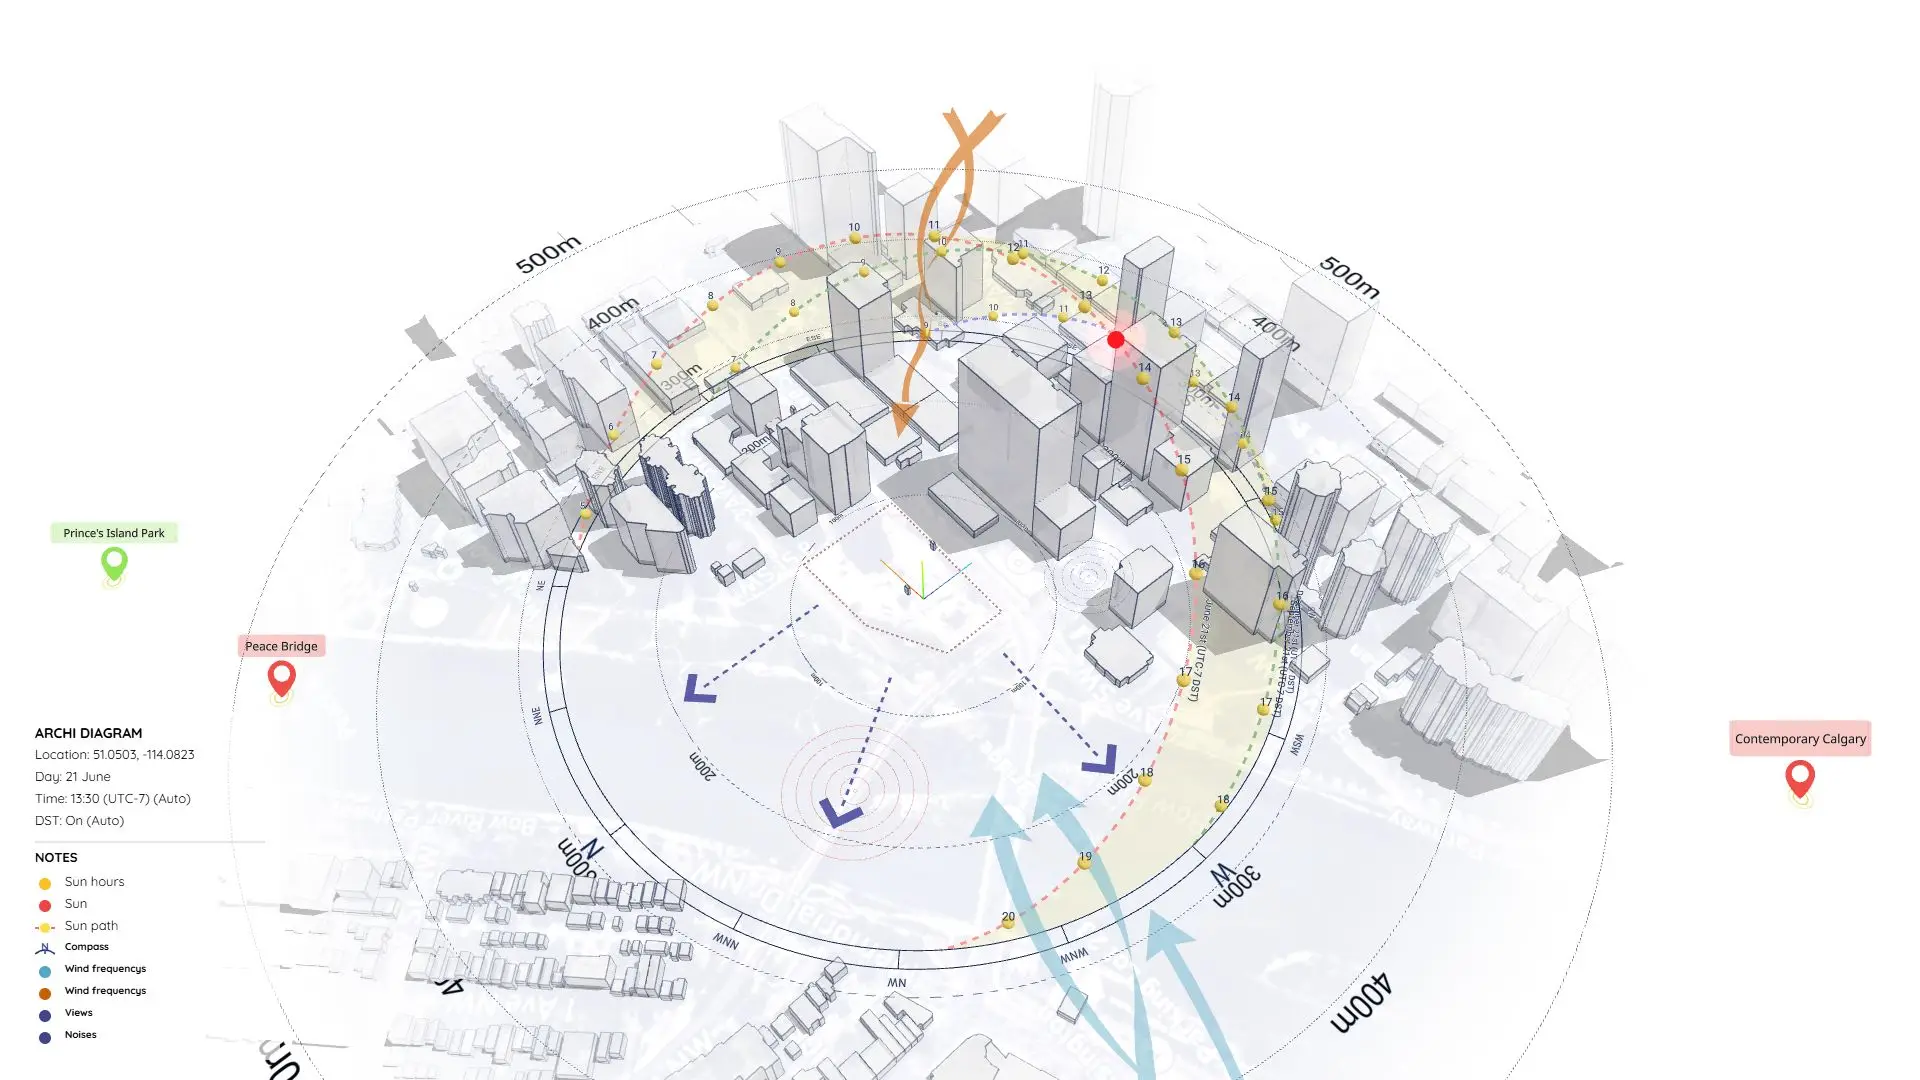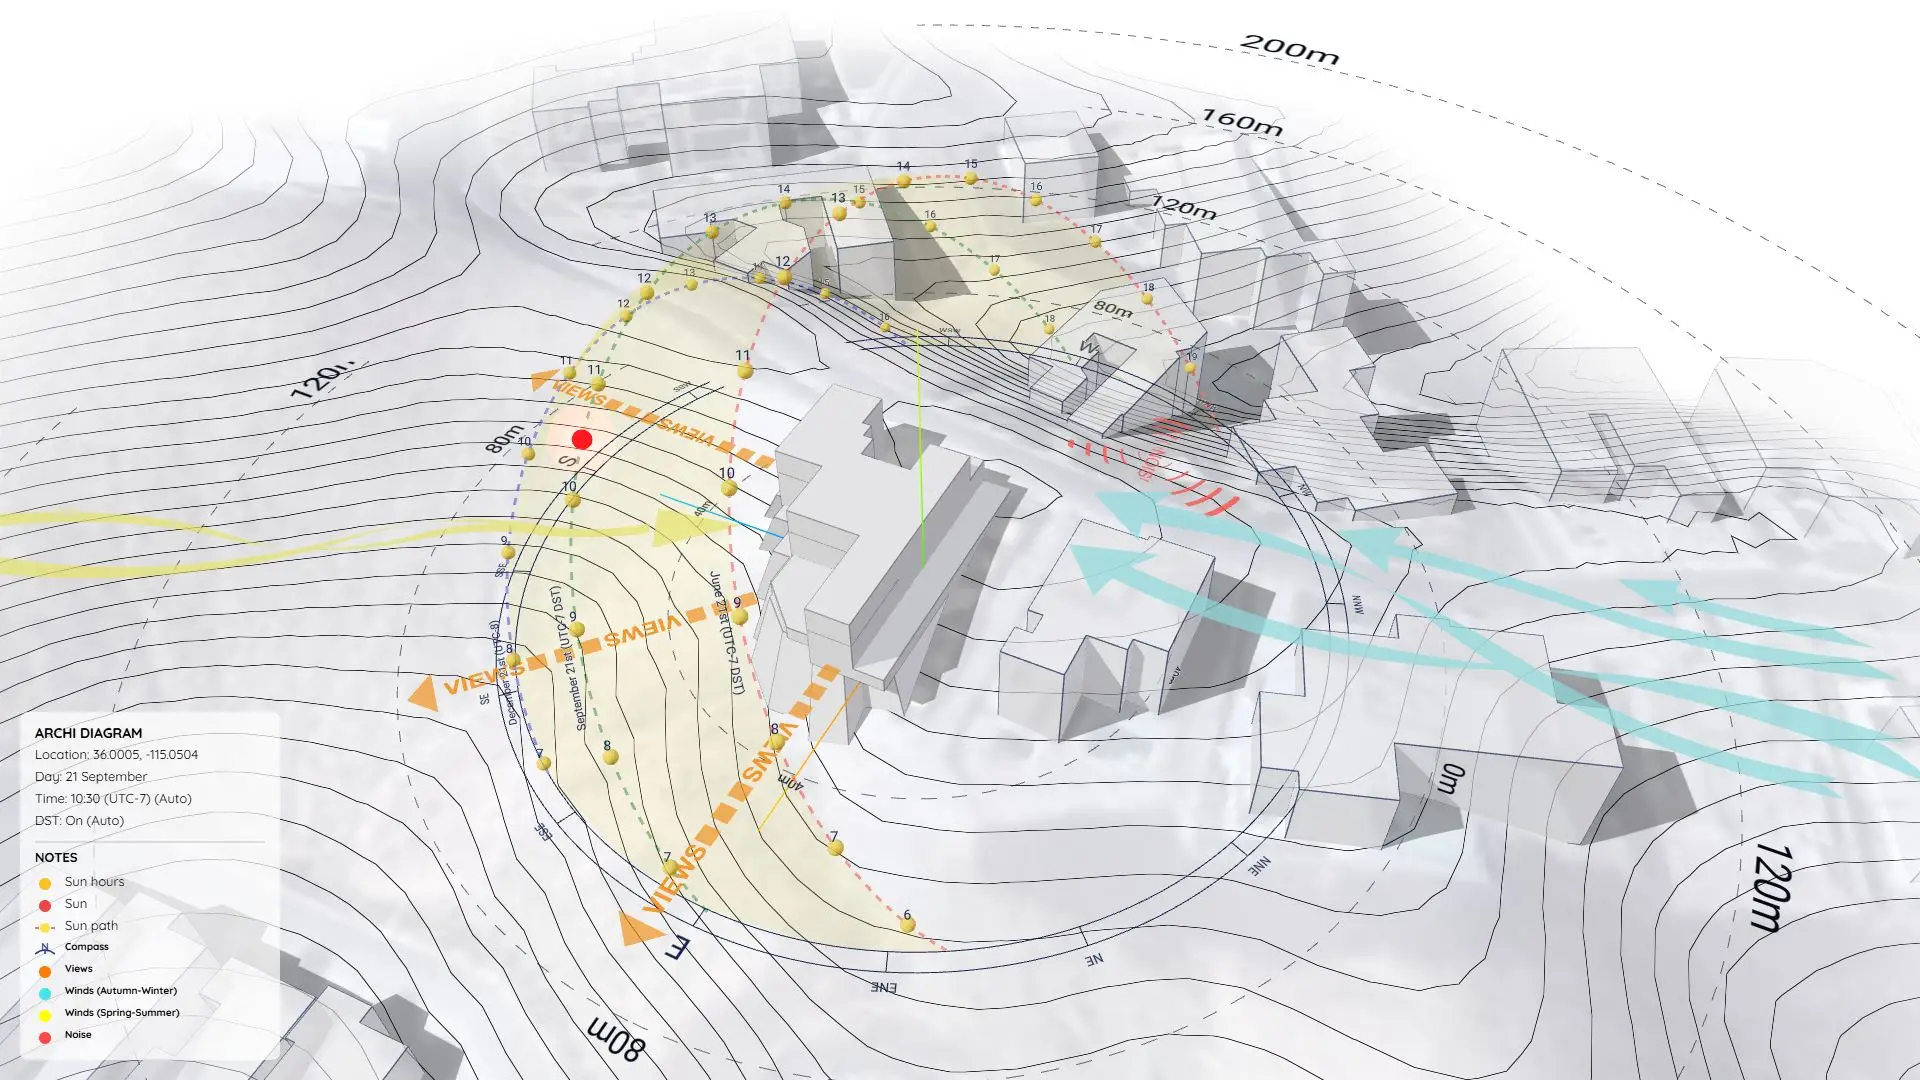

The Power of Shadow Analysis: Ensuring Design Integrity & Comfort
In architecture and urban planning, natural light and shadows are about more than just aesthetics. They determine spatial comfort, passive energy efficiency, and how well your building fits into its neighborhood.
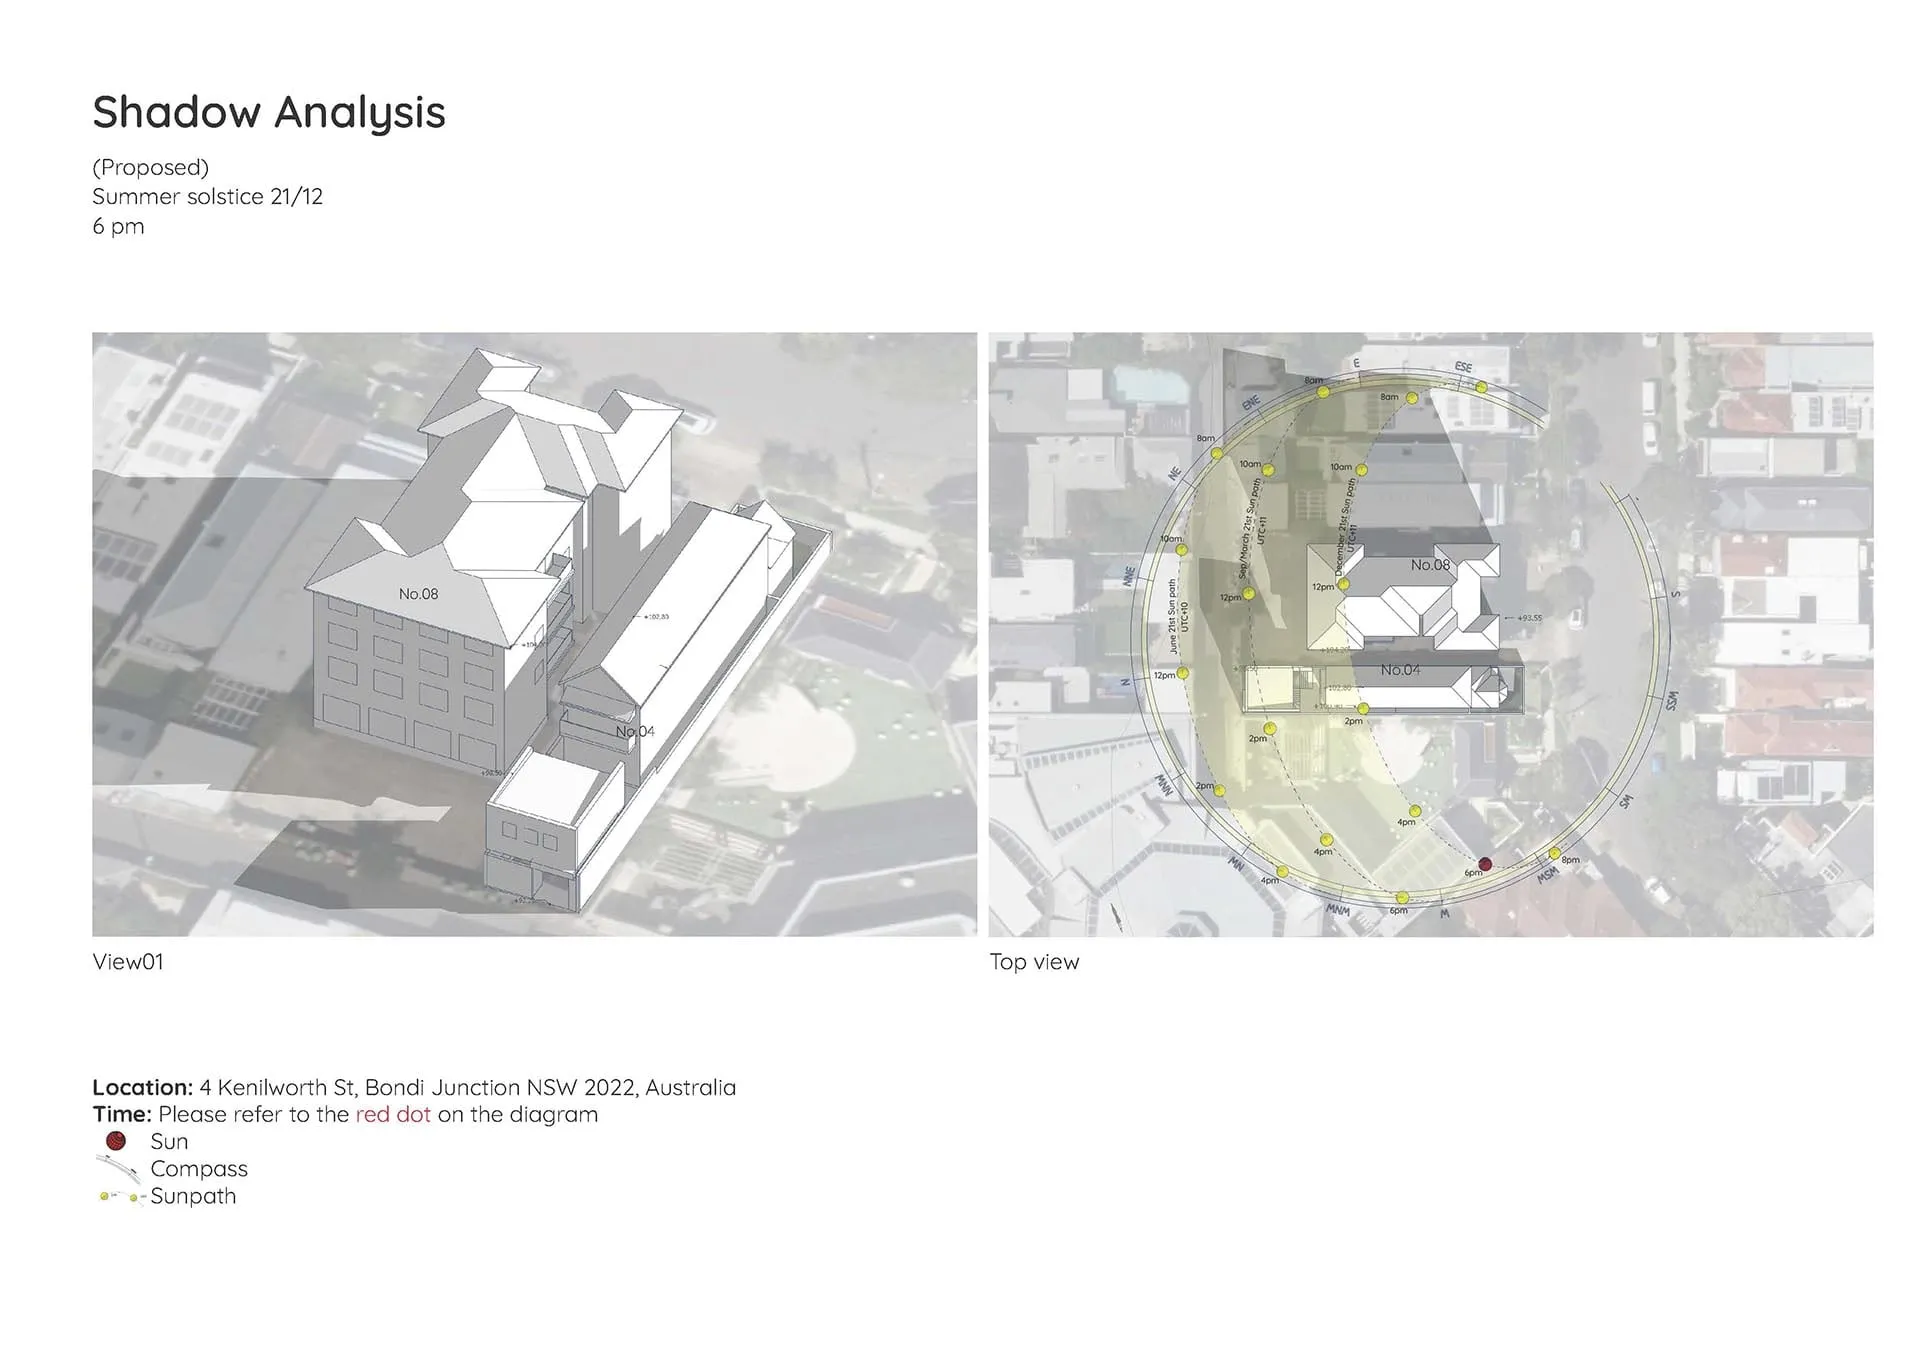
To show you how this works in practice, here is a recent Shadow Analysis project I conducted for a site in NSW, Australia.
The Core Objectives of the Analysis
When dealing with urban infill or residential projects, local councils often require a strict shadow study to ensure you aren’t blocking light to your neighbors. For this project, the main goals were:
- Assess Overshadowing: Accurately measure the shadow cast onto neighboring properties and public spaces.
- Optimize Facade Design: Use the solar data to tweak shading devices, overhangs, and window sizes.
- Ensure Compliance: Provide clear, visual proof to stakeholders and planning councils that the design meets local standards.
Breaking Down the Critical Timelines
Watch the short demo video below to see how the building’s shadow interacts with its environment throughout the year:
https://www.youtube.com/watch?v=Iqnq-_WzxZY
To get these results, we simulate the sun’s path across three vital milestones in the solar year. By combining 3D perspective views with Top Views (featuring a sunpath diagram and compass), we can track the exact shadow length hour by hour:
- Winter Solstice (June 21 in the Southern Hemisphere): Analyzed from 9:00 AM to 3:00 PM. This is when the sun is lowest, casting the longest shadows. It’s the “worst-case scenario” for daylight access.
- Equinox (March 21 & September 21): Analyzed from 8:00 AM to 4:00 PM. Represents average, transitional sunlight exposure.
- Summer Solstice (December 21): Analyzed from 7:00 AM to 6:00 PM. The sun is at its highest, providing crucial data for passive cooling and mitigating glare.
Streamlining the Workflow: The Sun Diagram Tool
Understanding solar geometry is one thing; efficiently presenting it to clients is another.
Creating smooth shadow animations and accurate 2D sunpath overlays in SketchUp used to be tedious and prone to time-zone errors. To fix this, I rely entirely on the Sun Diagram extension.
Built for architectural standards, Sun Diagram turns SketchUp into a solar analysis powerhouse:
- Interactive Dashboard: Real-time shadow sliders let you fluidly scrub through times and dates without touching SketchUp’s clunky native menus.
- Flawless Time Zone Logic: Automatically handles Daylight Saving Time (DST) and complex UTC time zones, ensuring your data is 100% accurate for council submissions.
- One-Click Sunpath Generation: Instantly drops a professional 2D graphic of the solar trajectory, compass, and time markers right into your Top View.
Stop guessing and start proving your design’s integrity. Streamline your entire SketchUp workflow today.
👉 Explore and download the Sun Diagram extension here
Download Sample Project Files
Ready to explore the setup? Download the free files below to test this workflow on your own machine and reuse the assets for your projects.
On Gumroad, simply enter $0 in the “Name a fair price” box to download for free.
(No bank or card information required.)
If you want to support me, you can enter any amount you wish. Thank you!