Climatic Site Analysis & Solar Orientation in SketchUp: Free Source Files (Project 57)

Ideally, a building should work with nature, not against it. This sample project (Project 57) shares the complete source files for a Climatic Site Analysis, focusing specifically on Solar Orientation and Terrain.

This SketchUp model demonstrates how to analyze a site with complex topography, helping architects determine the optimal building rotation to maximize winter sun and capture prevailing breezes.

Climatic Site Analysis

Why Focus on Solar Orientation?

Orientation is the single most important passive design decision. By studying the climatic conditions early, you can:

  • Maximize Energy Efficiency: Orient the building to gain free heat in winter (as shown in the December 21st analysis) and shade in summer.

  • Work with Topography: Understand how wind flows up or down a slope.

  • Optimize Views vs. Glare: Balance the desire for scenic views with the need to control harsh sunlight.

What This Sample Includes

This download provides the original SketchUp source files used to create the climatic study diagrams. Inside, you will find:

1. Topography & Contour Analysis

The model includes generated contour lines, essential for visualizing the slope and drainage patterns of the site.

2. Solar Orientation Study

A comprehensive 3D Sun Path visualizes the sun’s arc relative to the building’s specific rotation. (Pro Tip: This sun path was generated using the Sun Diagram plugin, allowing you to test different building angles instantly to find the “sweet spot” for solar access).

3. Prevailing Wind Visualization

The diagram uses stylized arrows to show how seasonal winds (Spring-Summer vs. Autumn-Winter) interact with the hillside. (Workflow Note: The flowing blue wind arrows were created using Dynamic Symbols, which makes it easy to draw curved paths that follow the terrain).

Workflow Overview

This sample follows a straightforward workflow commonly used for sunlight and shadow visualization:

  1. Step 1: Import Terrain and Map Data

  2. Step 2: Generate Contour Lines

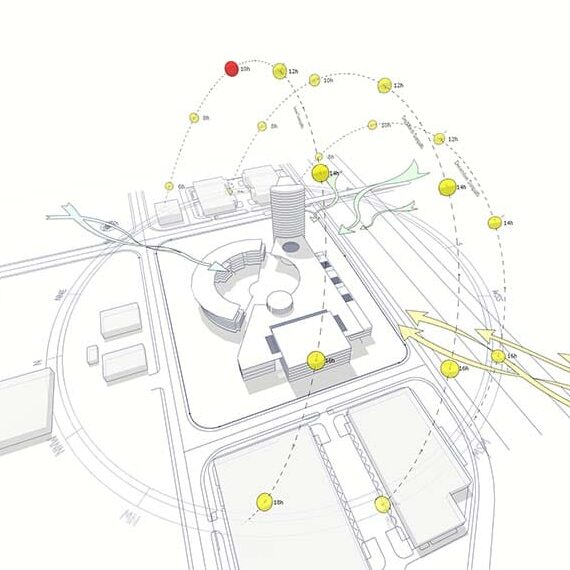
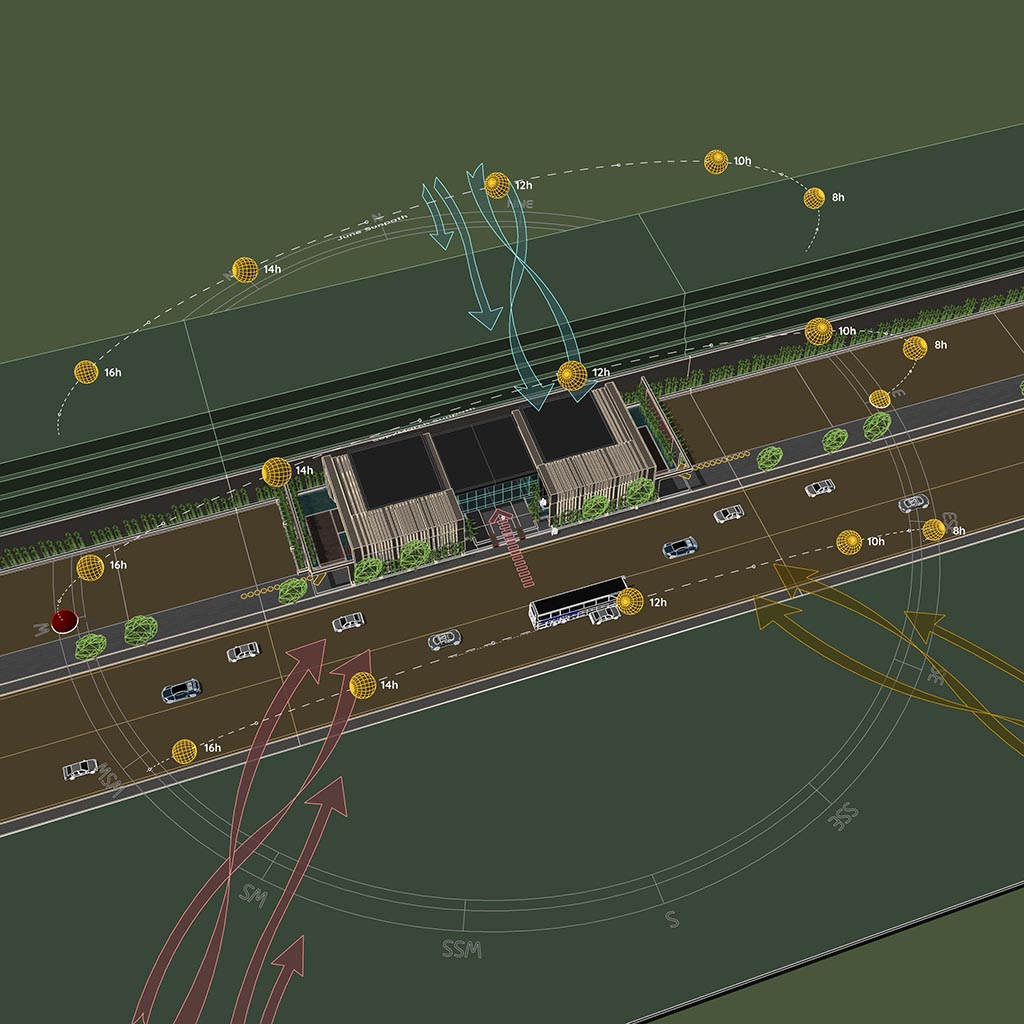
  3. Step 3: Create a 3D Sun Path using Sun Diagram Plugin

  4. Step 4: Add Symbols with Dynamic Symbols Plugin

  5. Step 5: Create a Shadow Analysis using Sun Diagram

  6. Step 6: Generate dynamic symbols to represent the Site analysis

This page focuses on the source files, not detailed instructions.

👉 A full step-by-step tutorial is available here: https://archidiagram.com/create-architectural-diagrams-updated-workflow-aug-2025/

Essential Tools for This Workflow

To replicate this analysis style or use the assets for your own projects, we recommend:

  • Sun Diagram: To generate the solar dome and perform accurate shadow studies on sloped terrain.

  • Dynamic Symbols: To draw the curved wind arrows and place directional markers quickly.

Good News: Free versions of both Sun Diagram and Dynamic Symbols are available for download on the Extension Warehouse.

Download Sample Project Files

This sample project is available for free download. Use it to master the art of climatic analysis and design buildings that truly fit their environment.

Or

On Gumroad, simply enter $0 in the “Name a fair price” box to download for free.
(No bank or card information required.)

If you want to support me, you can enter any amount you wish. Thank you!

About the Author

Nam Nguyen

Architect & Software Developer | Founder of Febhouse & ArchiDiagram

I build tools like Sun Diagram, Dynamic Symbols, and Shadow Slice to help architects work smarter.

Connect: Instagram | TikTok | LinkedIn