

Climatic Site Analysis & Solar Orientation in SketchUp: Free Source Files (Project 57)
In this sample project (Project 57), we’re sharing the complete SketchUp source files for a Climatic Site Analysis, with a specific focus on Solar Orientation and Terrain.
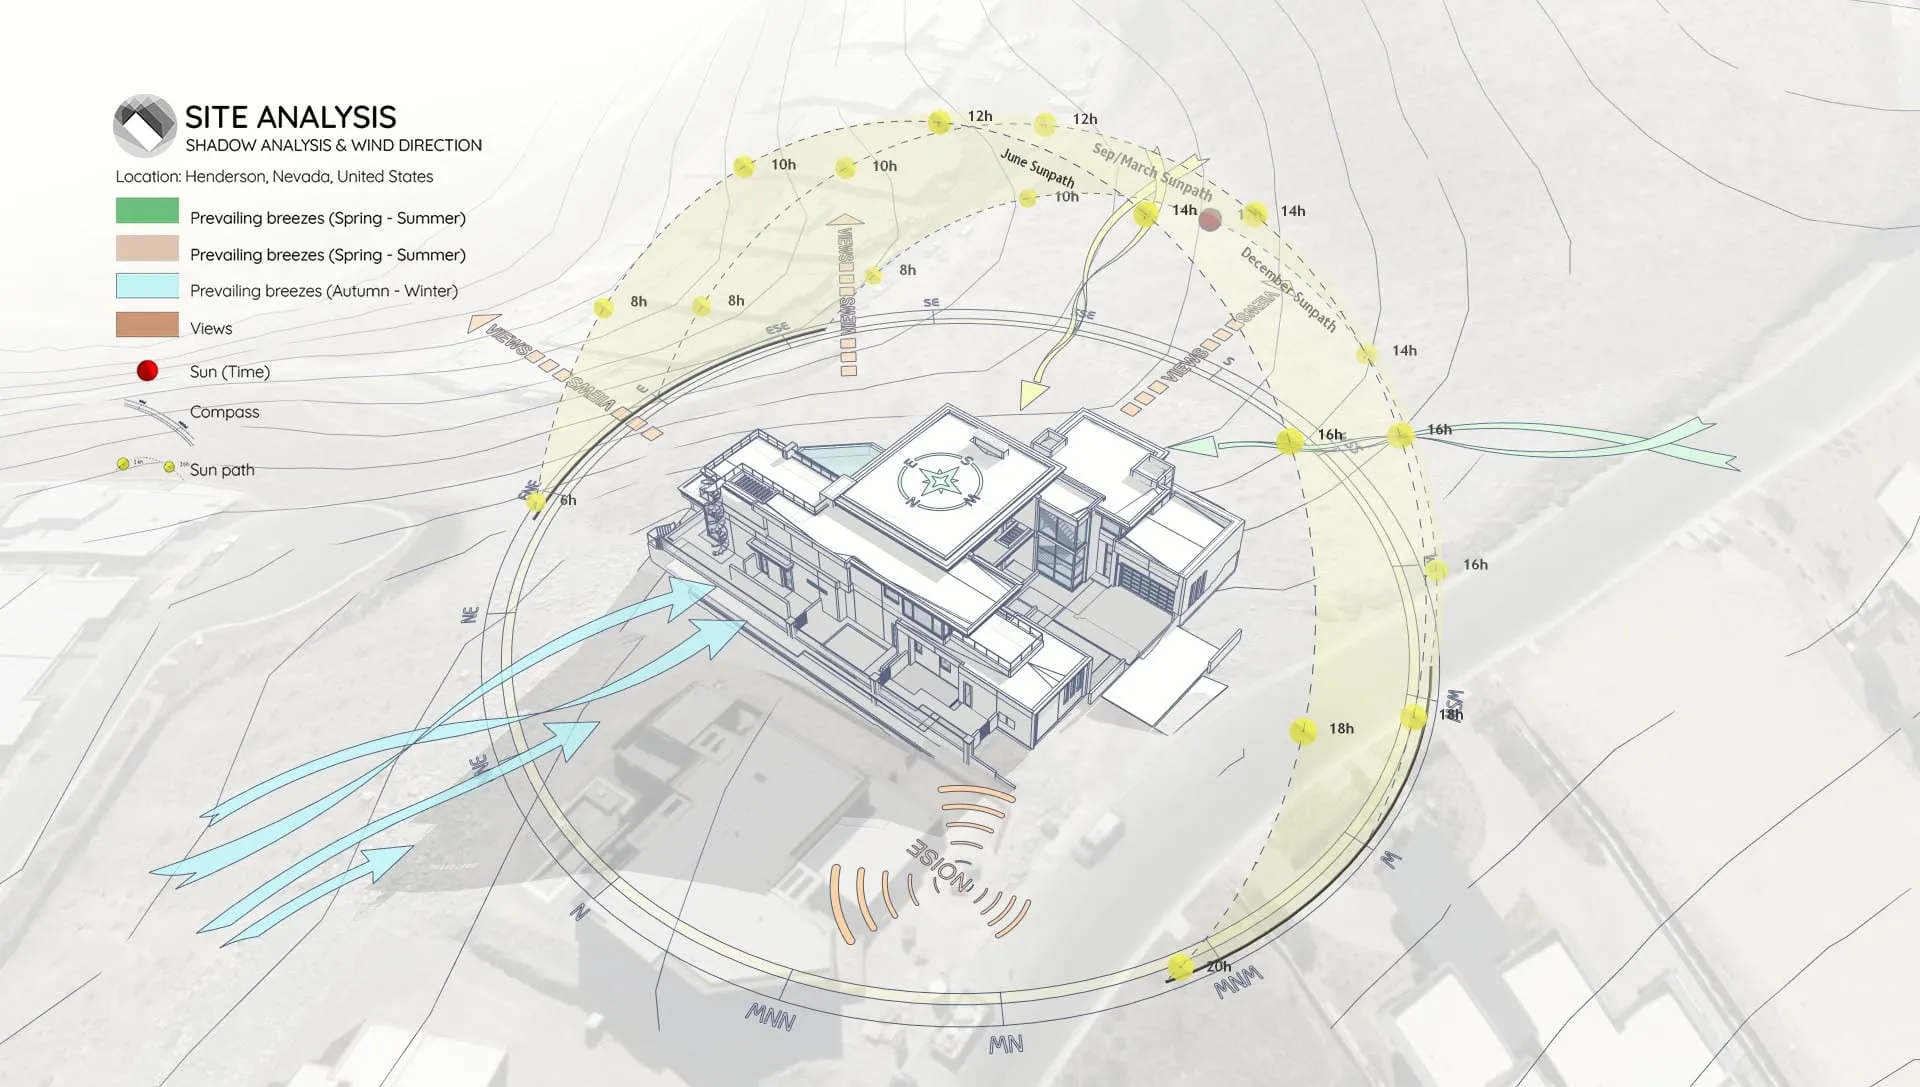
If you’re working with complex topography, this model will show you exactly how to analyze the site and find the perfect building rotation to capture winter sun while catching summer breezes.
Why Focus on Solar Orientation?
Getting your orientation right is the most effective passive design move you can make. This study helps you:
- Maximize Energy Efficiency: Orient the building to gain free winter heat and block harsh summer sun.
- Work with Topography: See exactly how wind flows up, down, and around the slopes.
- Optimize Views vs. Glare: Enjoy the scenery without blinding your clients.
What This Sample Includes
This download provides the exact SketchUp file we used to create our climatic diagrams. Inside, you’ll find:
1. Topography & Contour Analysis
Ready-to-use contour lines that clearly show the slope and drainage patterns of the site.
2. Solar Orientation Study
A full 3D sun path setup. (Pro Tip: We used the Sun Diagram plugin so you can quickly rotate the building and instantly see how the shadows change, helping you find the “sweet spot”).
3. Prevailing Wind Visualization
Smooth, curved arrows showing seasonal wind flows (Spring-Summer vs. Autumn-Winter) across the hill. (Workflow Note: We created these using the Dynamic Symbols plugin so the arrows naturally hug the terrain).
https://www.youtube.com/watch?v=fV5fIr1sL-8
Workflow Overview
This sample follows a straightforward workflow commonly used for sunlight and shadow visualization:
- Step 1: Import Terrain and Map Data
- Step 2: Generate Contour Lines
- Step 3: Create a 3D Sun Path using the Sun Diagram Plugin
- Step 4: Add Symbols with the Dynamic Symbols Plugin
- Step 5: Create a Shadow Analysis using Sun Diagram
- Step 6: Generate dynamic symbols to represent the Site analysis
(Note: This page focuses on the source files, not detailed instructions).
👉 Need the full tutorial? Check out the step-by-step guide here
Essential Tools for This Workflow
To replicate this analysis style or use the assets for your own projects, we recommend:
- Sun Diagram: To generate the solar dome and perform accurate shadow studies on sloped terrain.
- Dynamic Symbols: To draw the curved wind arrows and place directional markers quickly.
Good News: Free versions of both Sun Diagram and Dynamic Symbols are available for download on the Extension Warehouse.
Another Approach using ArchiDiagram App
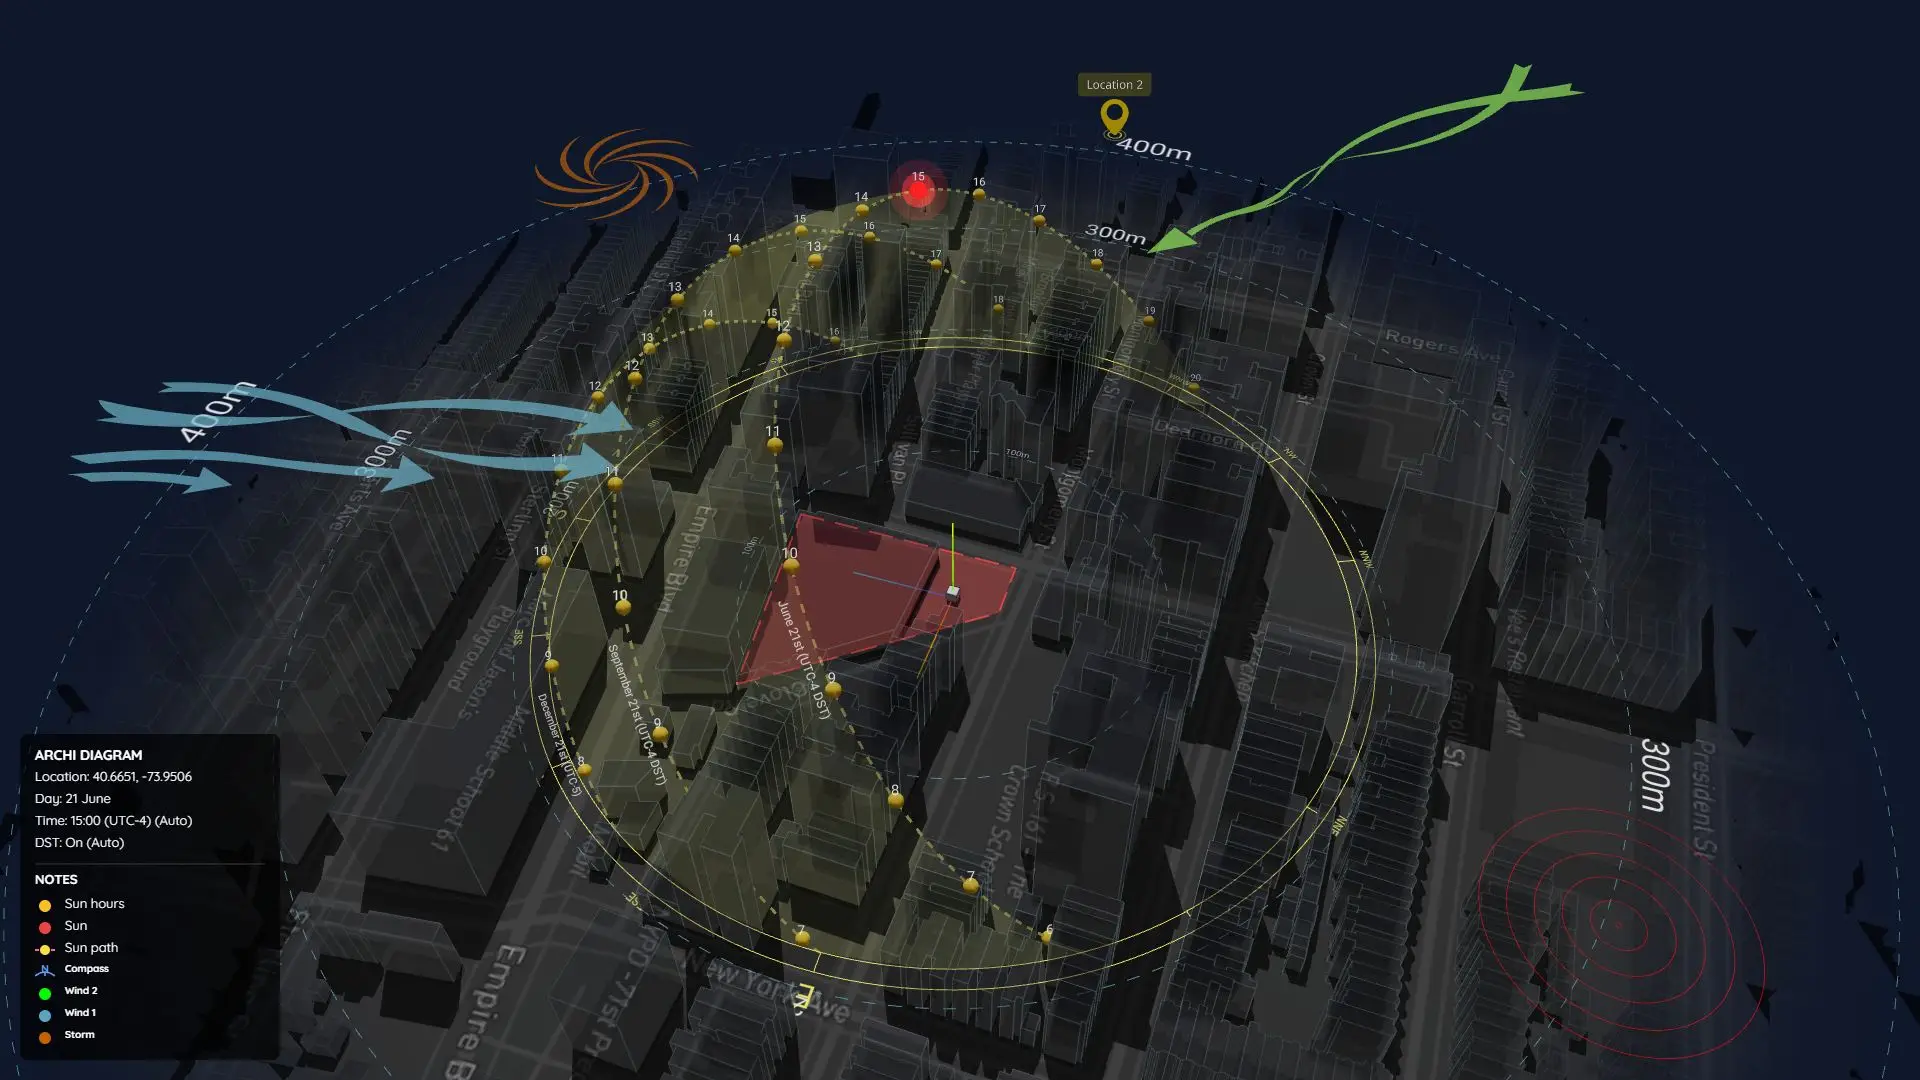
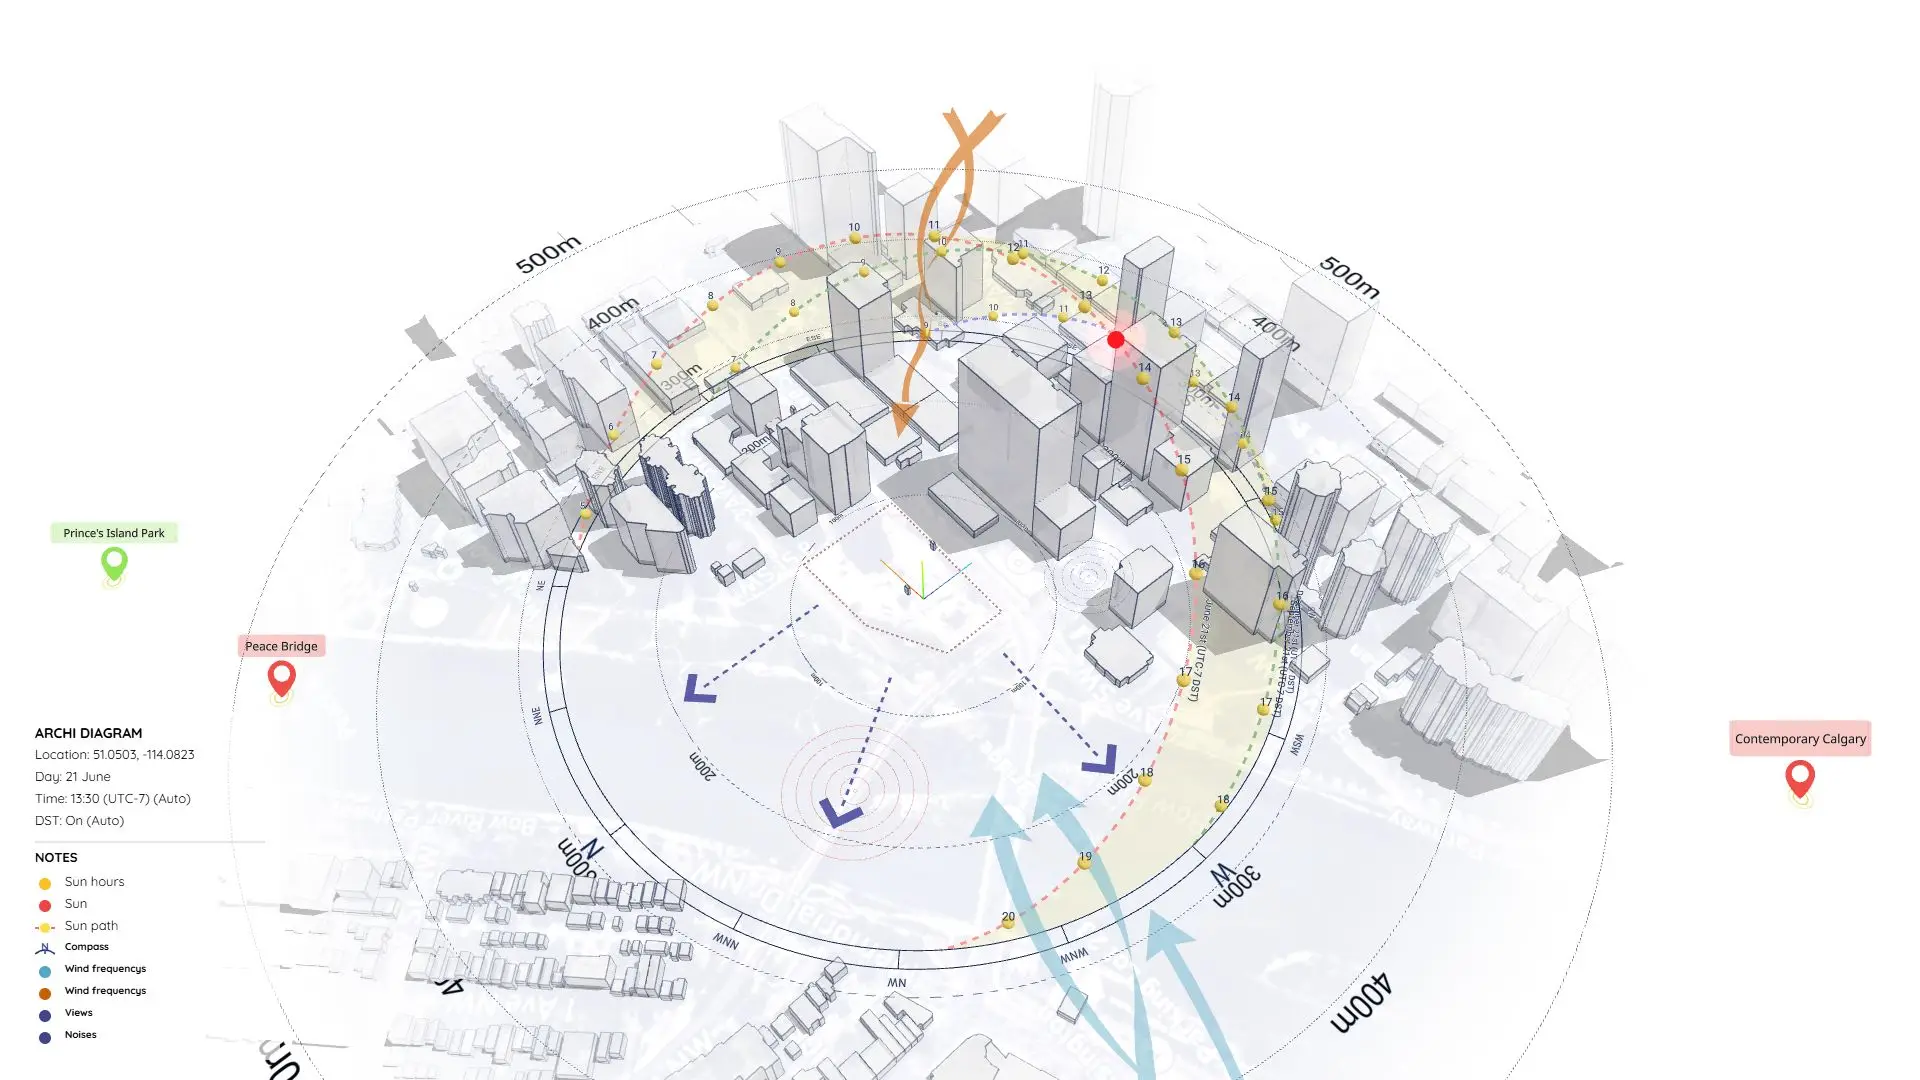
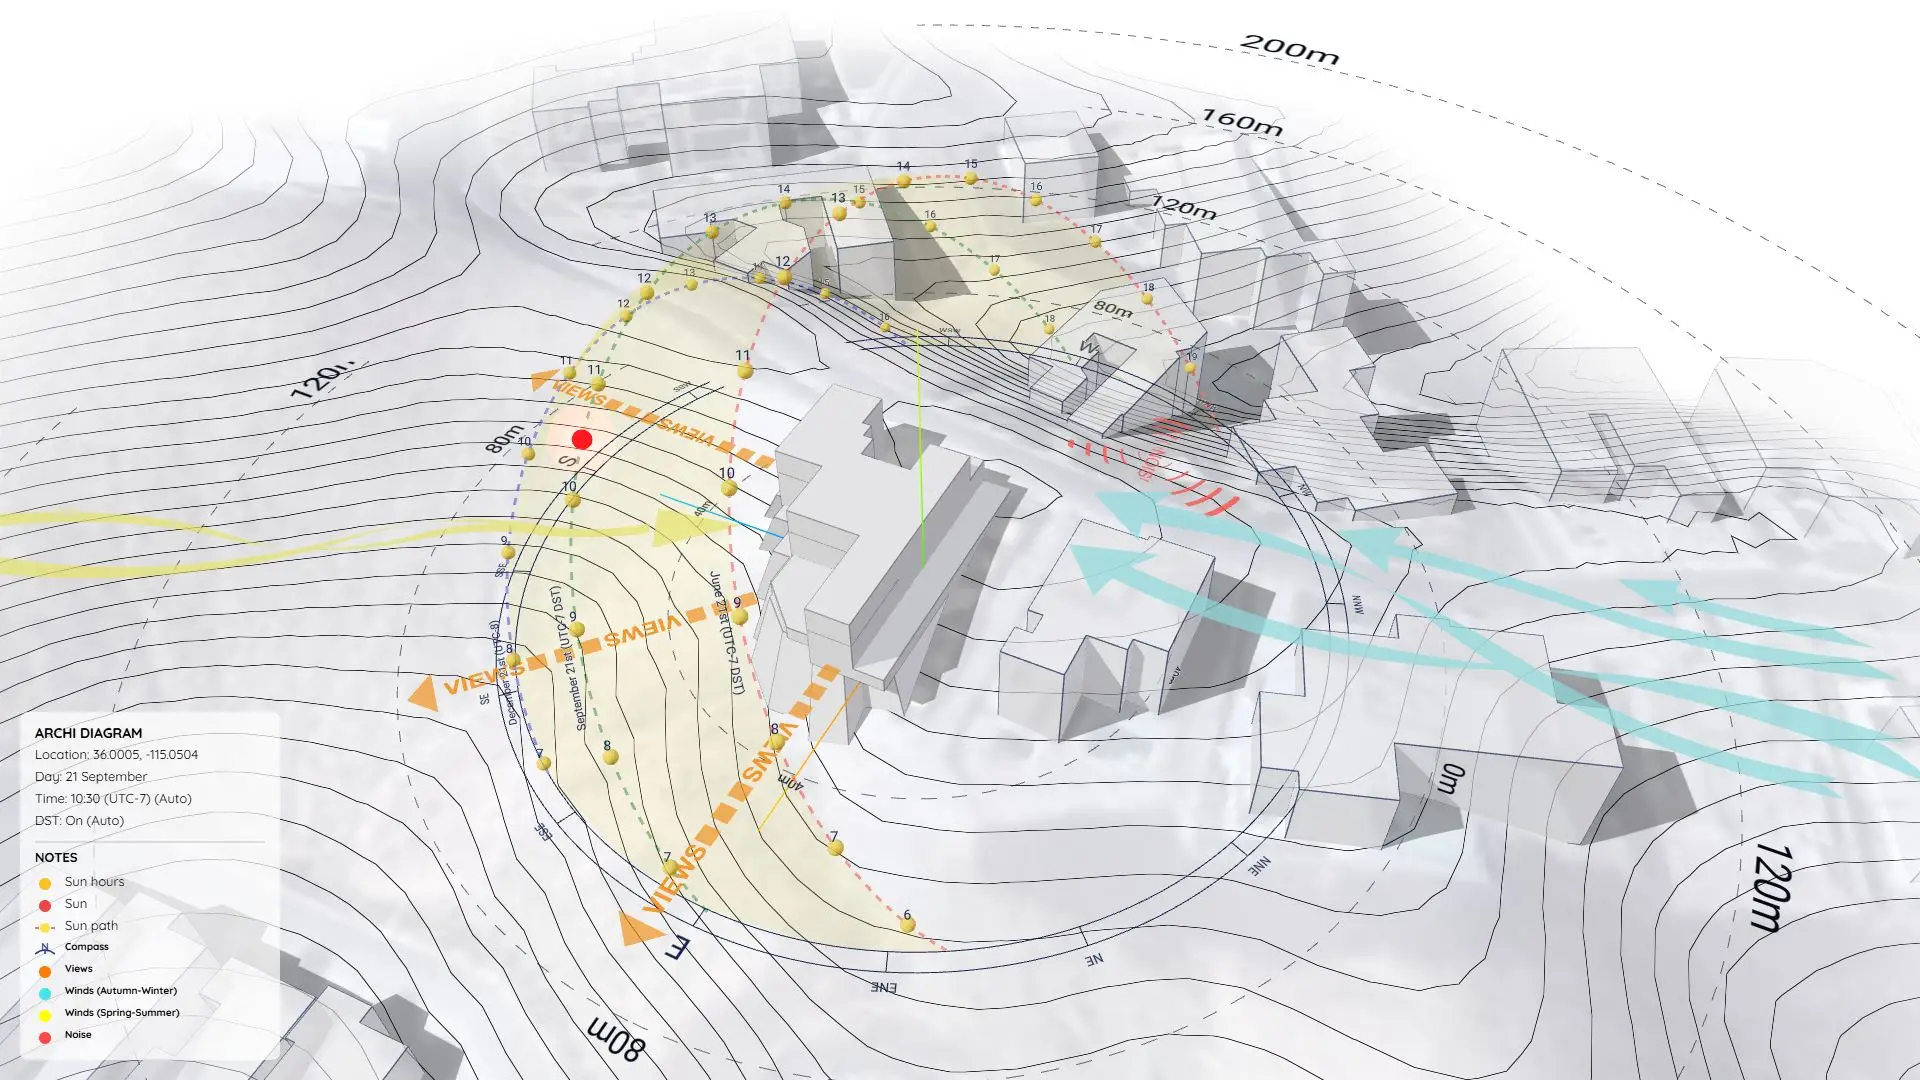
If you prefer a faster, web-based workflow without using SketchUp, you can check out how we remade this exact diagram using the ArchiDiagram App.
👉 See the ArchiDiagram App Version here
Download Sample Project Files
Grab the free files below, explore how it’s built, and start applying this analysis to your own projects!
On Gumroad, simply enter $0 in the “Name a fair price” box to download for free.
(No bank or card information required.)
If you want to support me, you can enter any amount you wish. Thank you!