

Context Analysis
https://www.youtube.com/watch?v=jUp8JCBoWmE
What is Context Analysis in Architecture?
In architectural design, context analysis is how we understand everything surrounding a site—physically, visually, environmentally, and culturally. It covers nearby buildings, roads, natural features, views, and noise sources. A strong context analysis is the backbone of responsive and meaningful design decisions.
Rather than working off assumptions, a clean diagram lets you communicate your constraints and opportunities clearly with clients, consultants, and approval authorities.
The Tools Used in This Project
To build the diagram shown in the video, I used two key tools right inside SketchUp:
- Sun Diagram: Generates an accurate 3D sun path and shadow analysis for any time and date. It visually proves how sunlight affects the site and nearby buildings.
- Dynamic Symbols: Drops in animated 3D symbols that you can toggle and adjust with a single click.
Both tools are designed to drastically speed up your diagramming workflow while keeping presentations clear and professional.
How the Diagram Was Created
Here’s a quick step-by-step of how I built this Context Analysis diagram:
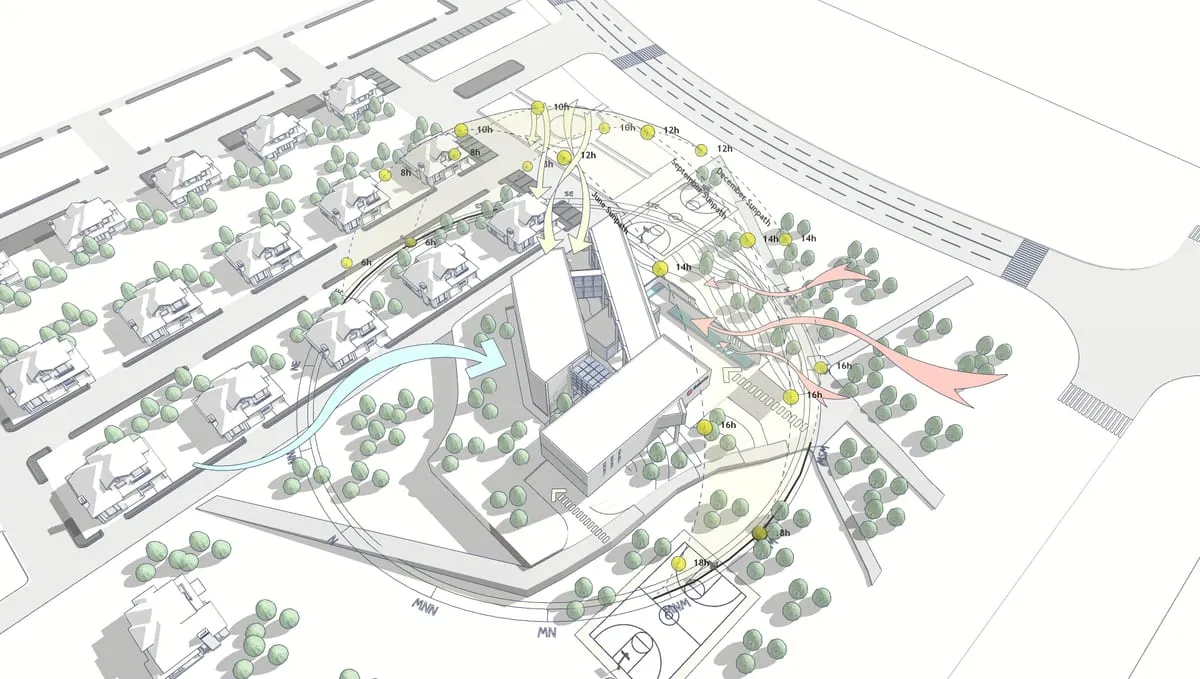
- Model the Basic Site and Surroundings: I imported the site plan and added rough massing for nearby buildings, roads, and green areas. Keeping it simple at this stage helps focus on spatial relationships.
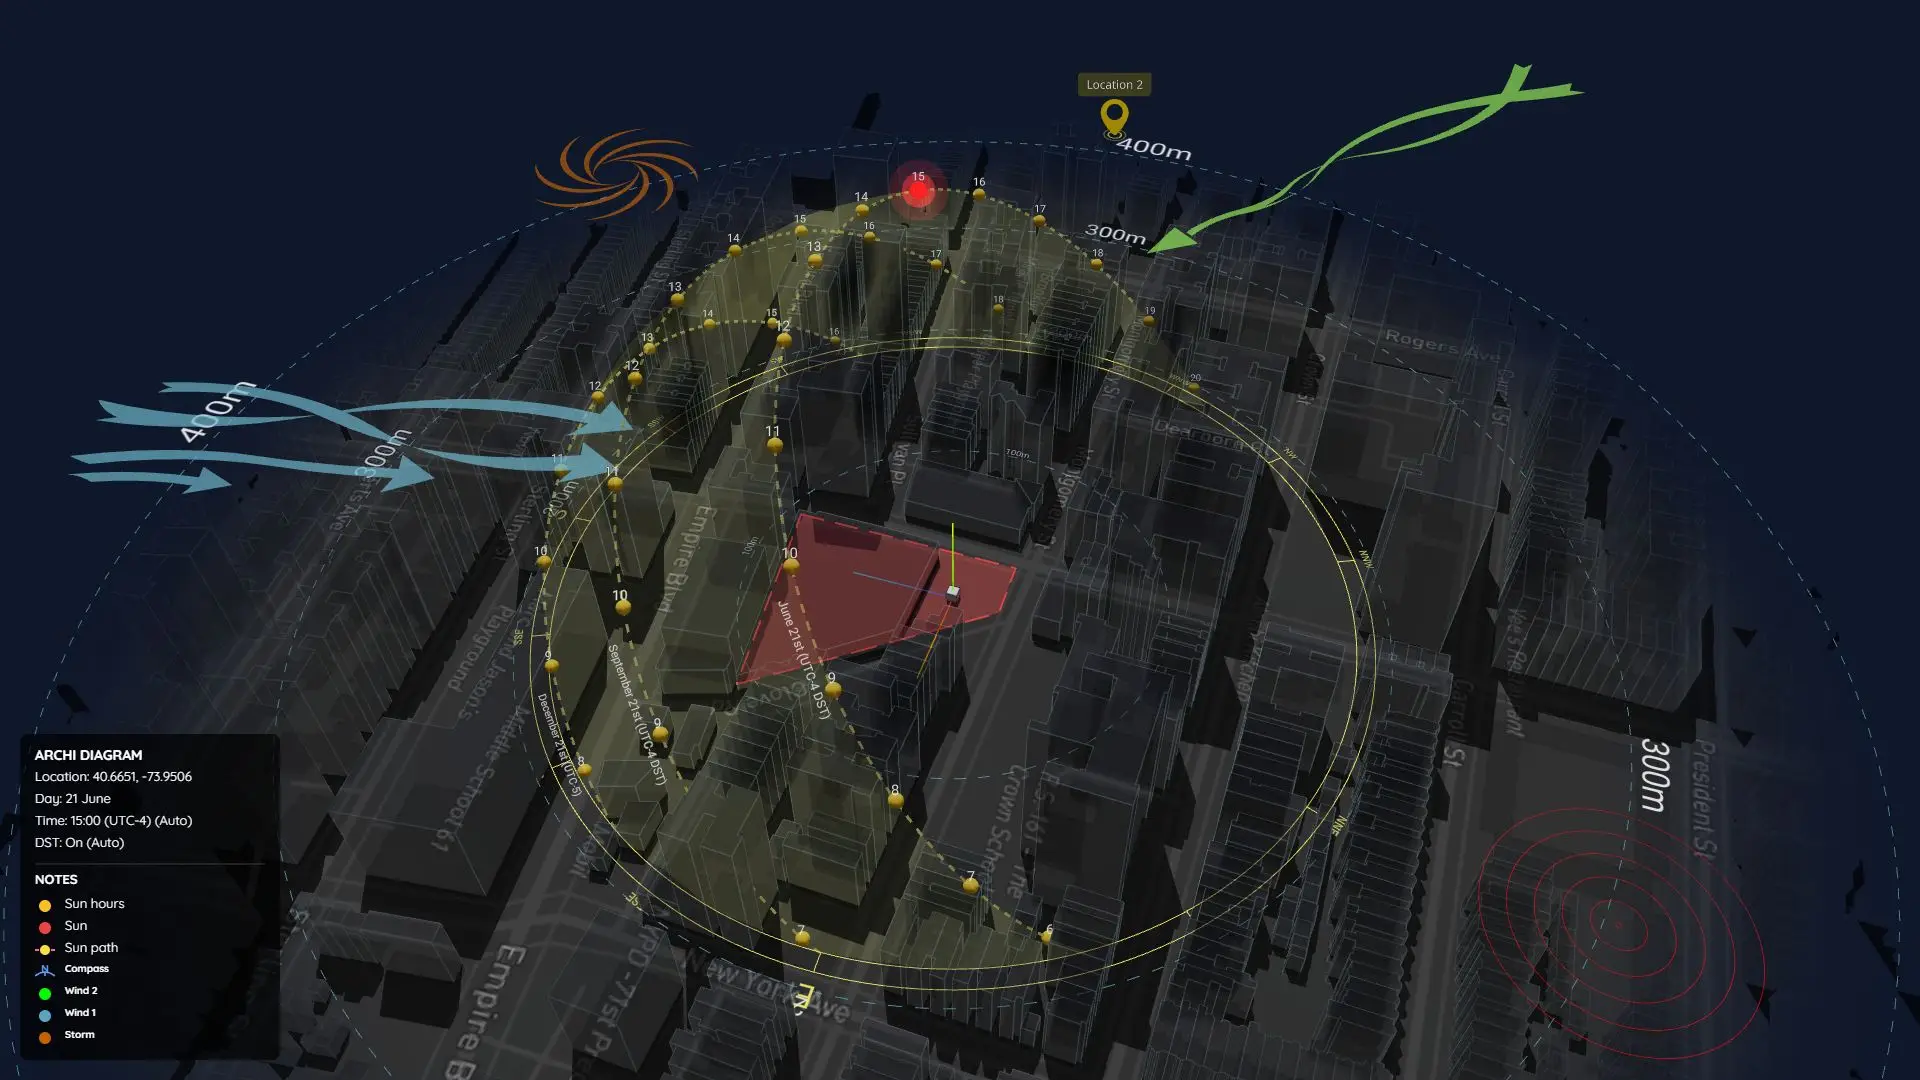
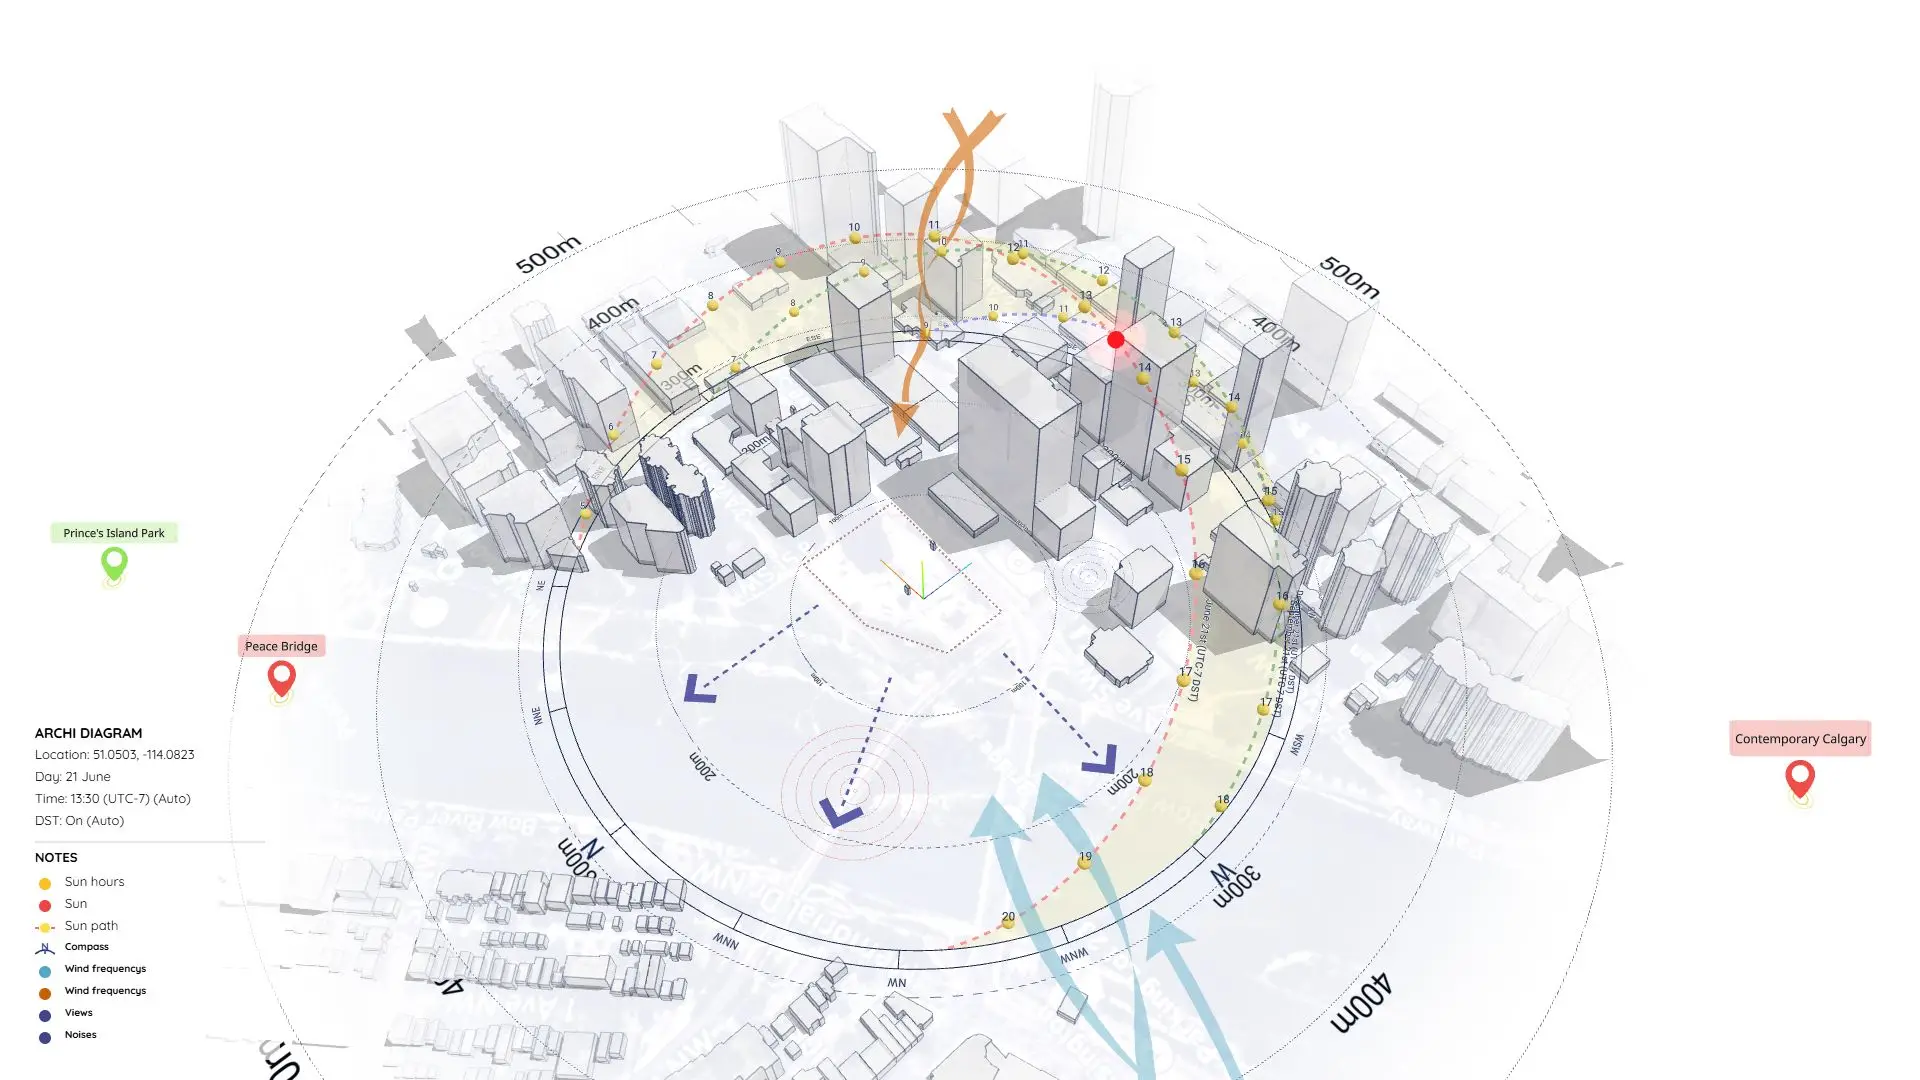
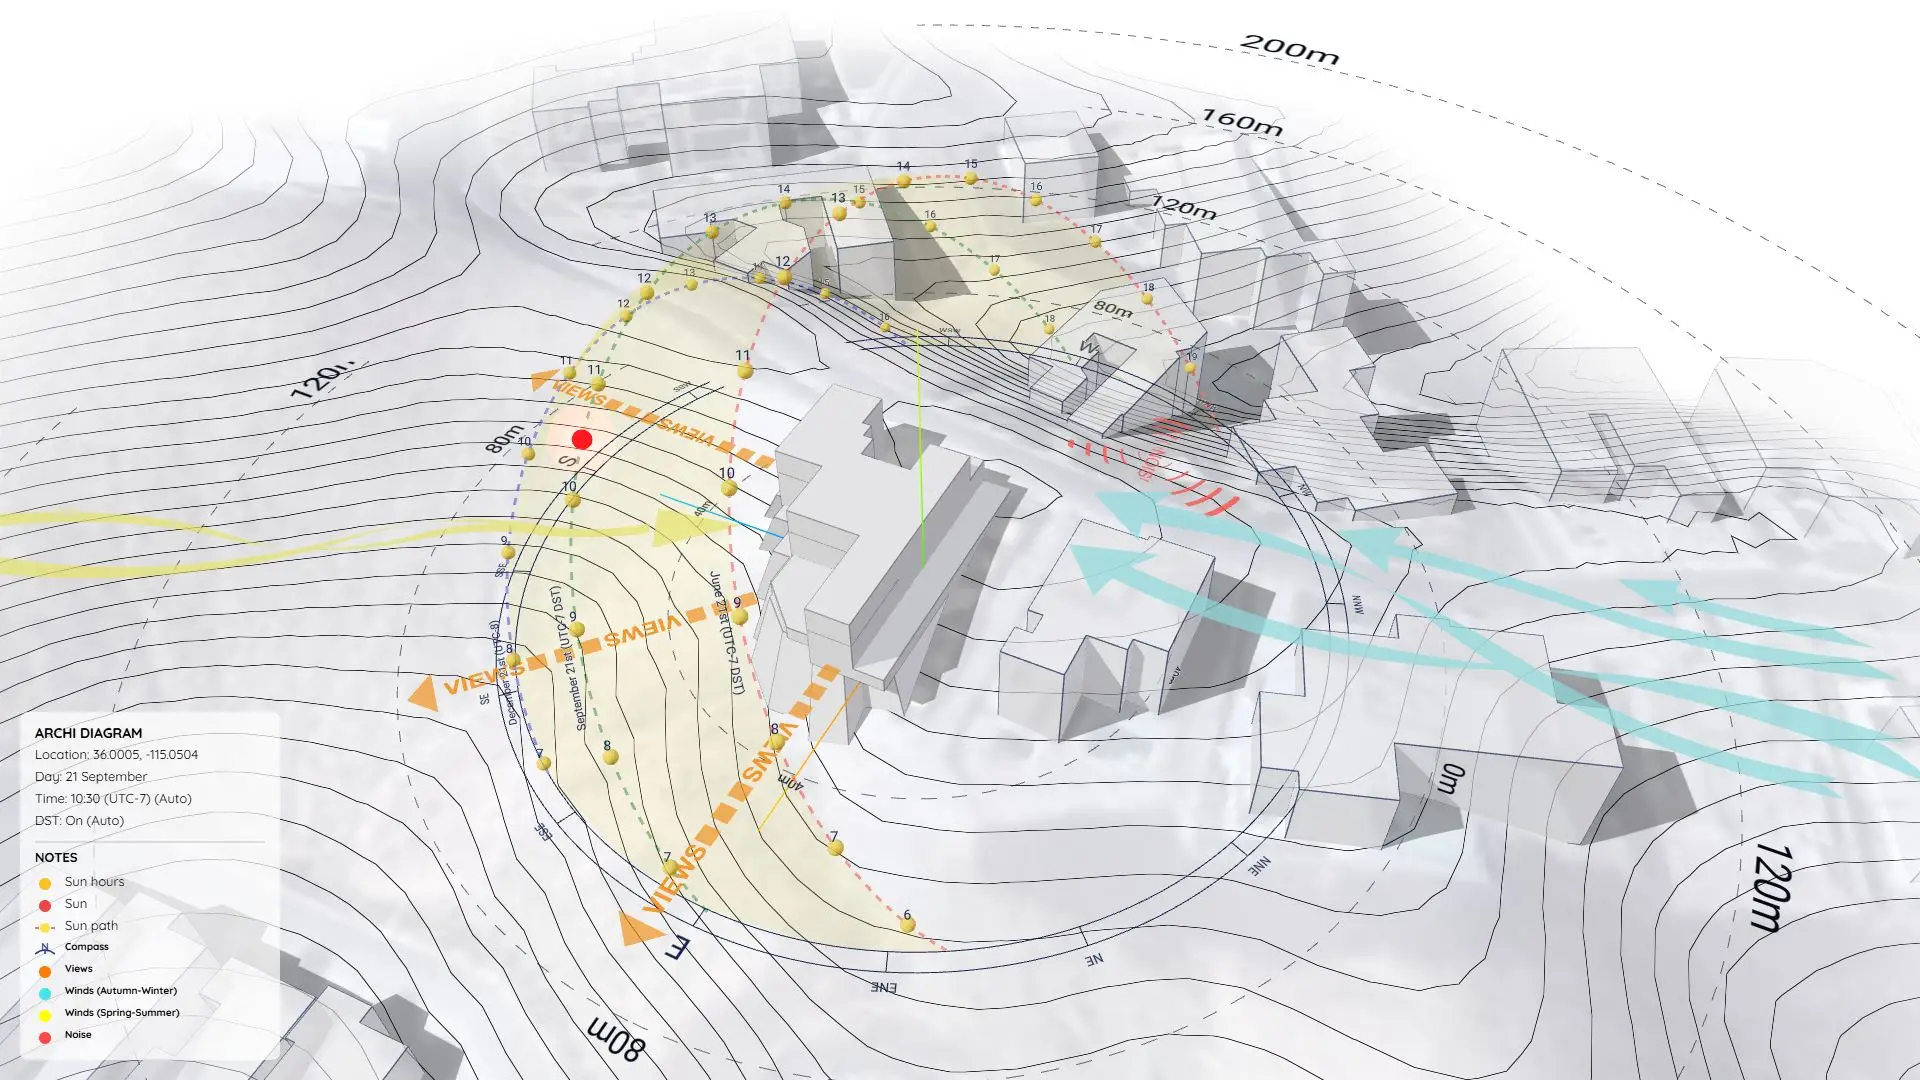
- Run Sun Path & Shadow Analysis: Using the Sun Diagram plugin, I selected specific times (9:00 AM, 12:00 PM, 3:00 PM) across key dates (solstices and equinoxes) to see exactly which parts of the site get sun or shade.
- Analyze Key Contextual Elements: I marked key views, noise sources, access points, and pedestrian flows. These directly influence building orientation and entry locations.
- Add Dynamic Symbols for Clarity: I used Dynamic Symbols to drop in wind arrows, circulation paths, and traffic icons. Since they’re already styled for architecture diagrams, it saved me hours of formatting.
- Compose the Layout: Finally, I exported the scene with proper composition, a north arrow, and a clean graphic style—all done inside SketchUp.
Why This Matters
Too often, site analysis diagrams are either too rough to be useful or take way too long to produce. With the right tools, you can quickly create professional, data-driven visuals that help you defend your design ideas.
Whether you’re in early concept phases, prepping for a client meeting, or applying for permits, this method saves time and elevates your work.
Download Project Files
Want to see exactly how this was set up? Download the project files below!
On Gumroad, simply enter $0 in the “Name a fair price” box to download for free.
(No bank or card information required.)
If you want to support me, you can enter any amount you wish. Thank you!
(Need a detailed, step-by-step tutorial on this process? Check out our complete guide here: /create-architectural-diagrams/)